Executive Summary
Over the past few years, fuel has become a larger percentage of the trucking industry’s cost structure1, and a higher emphasis has been placed on reducing greenhouse gas (GHG) emissions for on-road vehicles.
Could autonomous trucking be a solution to improve fuel efficiency and reduce harmful emissions? TuSimple set out to explore and assess the current real-world fuel savings performance of its Level 4 (L4) autonomous technology. The team analyzed more than 30,000 miles of highway driving, consisting of a roughly 50 – 50 split between manually driven and autonomously driven miles, and compared the fuel efficiency performance of the company’s highly skilled and experienced professional drivers versus its autonomous driving system.
Our autonomy teams discovered an overall 11% advantage in fuel efficiency versus manually driven trucks. The study went one step further than previous studies and broke down fuel economy by event types. While the study produced a ~6% fuel savings cruising at highway speeds, the data revealed significant fuel efficiency benefits in other highway events such as following a slow vehicle and front vehicle cut-ins, experiencing improvements of over 10% and 27% respectively.
While safety was not within the scope of this study, it is generally understood that smoother and more preemptive driving patterns lead to safer driving. TuSimple believes the adoption of L4 autonomous technology has the potential to decrease fuel usage and create a safer driving environment for all road users.
So how does this translate to the real-world? Assuming one out of every five trucks in long-haul operation in the U.S. improved fuel efficiency by 11%, annual fuel-cost savings generated would be nearly $1.2 billion. Carbon emissions would be reduced by nearly 6.3 billion pounds as diesel usage would be reduced by over 279 million gallons. Taking this one step further and applying an 11% fuel efficiency improvement to a trucking company with a fleet of 1,000 trucks that each average 120,000 highway miles per year, fuel savings would be approximately $7.5 million. Carbon emissions would be reduced by 38 million pounds as diesel gallons used would be reduced by approximately 1.7 million gallons. These results show not only a financial benefit to the industry, but also a societal benefit in the form of reduced GHG emissions.
Find Your Estimated Fuel & Emissions Savings
Find Your Estimated Fuel & Emissions Savings


Find Your Fuel & Emissions Savings
11% Fuel Efficiency Improvement with TuSimple's Autonomous Driver
TuSimple conducted a study exploring the fuel efficiency improvements of its Level 4 autonomous trucks. The results show an 11% improvement with TuSimple's autonomous driver versus manually driven trucks, allowing fleets to save money, gas and reduce emissions. Learn more about how TuSimple's autonomous driver is reshaping fleet efficiency and sustainability in our latest white paper.
Introduction
The trucking industry is vital to the American economy. During the pandemic in 2020, even when truckers were classified as essential workers, we saw firsthand the impact on the U.S. supply chain when many parts and goods were in short supply.
The American Trucking Association reports that trucks account for 70% of the total domestic tonnage shipped. This industry plays a vital role in delivering goods to the market, employing over 8 million individuals, and covering a staggering 327 billion miles annually.2
When looking at the impact the trucking industry has on the U.S., it would be hard to ignore the environmental impact that more than 13 million operating trucks create. The Environmental Protection Agency (EPA) reported that the transportation sector accounts for the largest portion of total U.S. GHG emissions, at just shy of 30%. Within transportation, medium- and heavy-duty trucks make up the second largest category with 23% of emissions, an increase from 15% in 1990. Put another way, while GHG emissions have increased for the entire transportation sector, medium- and heavy-duty trucks have outpaced the overall sector over the last 30 years, increasing 78% while the rest of on-road vehicles have increased by only 10% according to the EPA. The highest source of these greenhouse gassesare emitted through the combustion of fuels.
In recent years, we have seen a surge in companies placing a major emphasis on Environmental, Social, and Governance (ESG) issues. These factors are seen as best embodying three major challenges facing corporations and wider society, now encompassing climate change, human rights, and improved corporate governance. With a stronger focus on environmental issues, companies are working diligently to understand how their operations impact the environment and what specific technologies have the potential to reduce emissions and generate savings.
In TuSimple’s 2021 ESG report, it states that autonomous trucks can reduce GHG emissions by increasing asset utilization. In an autonomous vehicle, the deployment of vehicle-control methods, such as eco-drive, is more efficient. This changes the powertrain operation in response to driving conditions, leading to better fuel economy.
In 2023, TuSimple completed a study to further explore the fuel efficiency benefits of its L4 autonomous truck technology. This paper will take a close look at how the study was conducted, the scenarios that were tested and the findings which could lead to millions of dollars in annual fuel savings and reduction of GHG emissions
Trucking Industry Cost Structure
The two largest costs per mile for trucking companies are the driver at ~40% of total costs, followed by fuel at ~30%1. Autonomous technology has the ability to impact approximately 70% of the total cost per mile and generate significant savings for the trucking industry. The trucking industry averages a 98.6%5 operating ratio, meaning the industry as a whole is barely profitable. While the best operators that focus on efficiency and execution do earn returns above their cost of capital, the entire industry can benefit from adopting autonomous technology.
Industry Levels of Automation
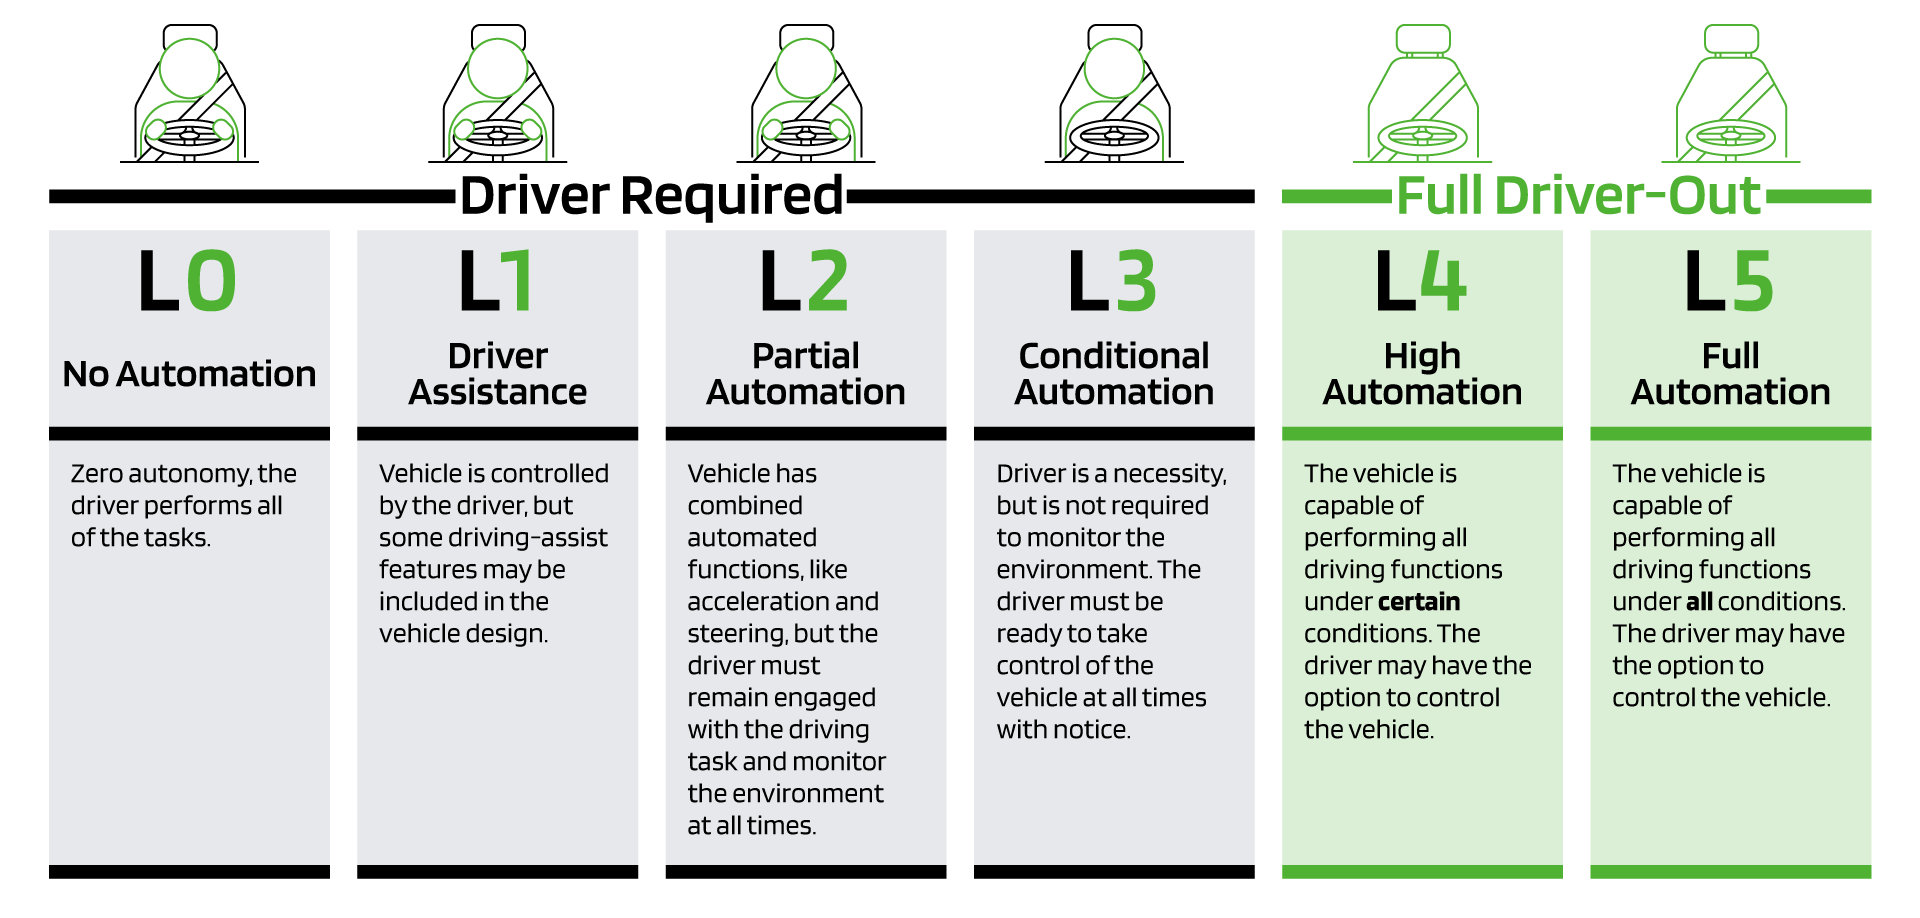
The Society of Automotive Engineers (SAE) categorizes driving automation into six levels from Level 0 to Level 5 (L0 – L5). L1 and L2 are described as driver-support functions, or advanced driver-assistance systems (ADAS), while L3, L4, and L5 include more automated driving features. L4 is the first level of autonomy that has the ability to remove the driver from the cockpit. TuSimple’s L4 autonomous technology was the subject of this study.
Purpose and Objectives of the Study
TuSimple set out on a mission to thoroughly investigate and evaluate the real-world fuel savings achieved by its L4 autonomous technology, with a focus on its applicability in practical fleet operations. The primary objective of this study is to quantify the actual improvement in fuel economy for highway operations, as this represents a significant portion of the operational design domain (ODD) for long-haul trucks. Furthermore, given the variation in operating conditions and fuel efficiency across different scenarios, TuSimple aimed to pinpoint the specific conditions where its autonomous driving technology excels in improving fuel efficiency, ensuring consistency in the observed fuel-saving benefits.
Event-Driven Analysis
Motivation
One of the main difficulties in assessing the contributions of L4 autonomous technology to fuel savings is the large variety of driving scenarios. Driving scenarios can be roughly divided into interactive (driver merge, driver cut-in, lane change behind driver, lane change in front of driver, etc.) and non-interactive (highway cruising, accelerating on empty ramp, etc.). The total fuel savings will depend on the distributions of these scenarios on a given route, which can vary based on time of the day, proximity to urban areas, etc. In order to evaluate fuel savings over a large variety of scenarios, TuSimple required explicit definition of scenarios. To that end, the company introduced the concept of events.
Event Types Involved in the Study
An event is defined as a strict and explicitly predetermined sequence of driving maneuvers that represents a family of driving scenarios. In order to thoroughly evaluate the source of a fuel economy benefit inherent to autonomous driving, a number of event types were introduced and analyzed. For the purposes of this study, the focus is on four event types that concisely convey the main findings and are valid representations of the whole set of events. Moreover, the scope of this study is concentrated on the highway domain.
Figure 2, below, provides a visual summary of the four event types and what scenario each represents. The first event type, named ‘Aggregated Highway’, is the collection of all events occurring on highways, representing nearly all driving scenarios. The ‘aggregated highway’ contains the other three event types as its subsets. This event quantified the overall fuel economy improvement and covered the combination of both interactive as well as non-interactive events.
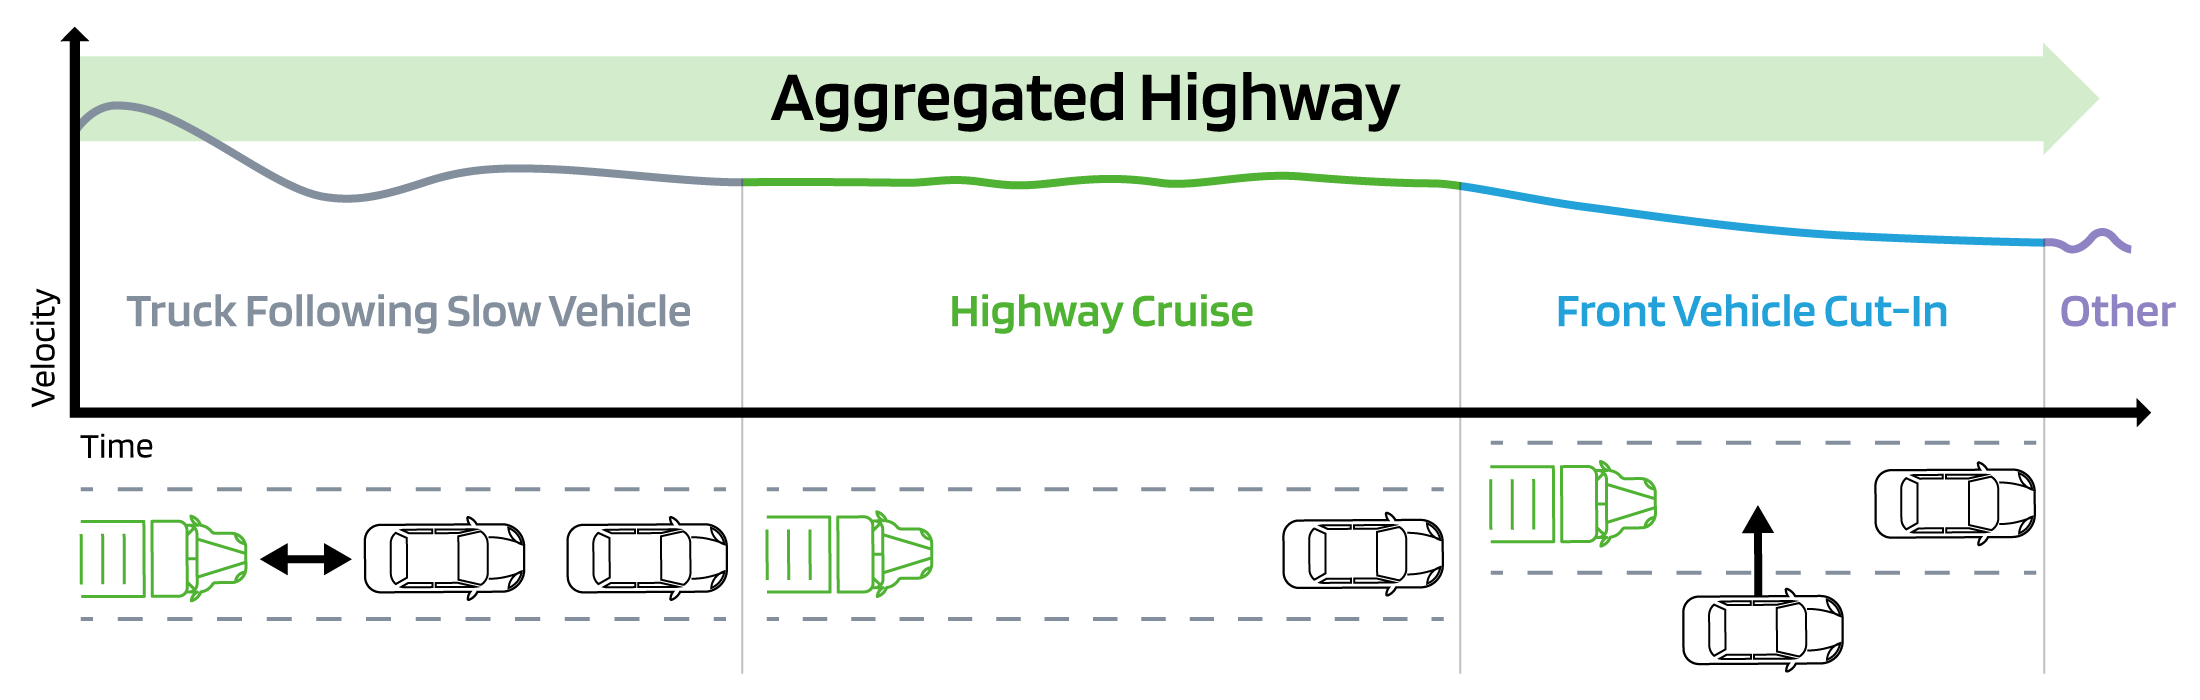
The second event type, ‘Highway Cruise’, captured scenarios of nearly constant speed and minimal vehicle interaction. It is shown in the middle of Figure 2, above. This event was extracted by checking if the speed falls within the cruise speed range of 60-75 mph and whether the speed remained roughly constant during the entire event. There are two reasons why a ‘Highway Cruise’ event was important to include in this investigation. Firstly, based on the definition of the event, it is expected that the fuel economy of the autonomous system should be slightly improved compared to manual, but not as much as in more dynamic and interactive events (merging, cut-ins,…) where artificial intelligence and long-range perception give autonomous systems an operating advantage to manual driving. Therefore, ‘Highway Cruise’ events serve as the benchmark because the result is anticipated as mentioned above. Secondly, the ‘Highway Cruise’ events constitute the majority of highway operations and therefore have significant impact on the fuel economy.
The last two event types, known as ‘Truck Following Slow Vehicle’ and ‘Front Vehicle Cut-In,’ showcase how the autonomous system performs during interactions with other vehicles. These event categories are expected to demonstrate the benefits of artificial intelligence and advanced perception in terms of fuel economy savings. While they don’t encompass all possible interaction scenarios, they provide a good representation, as they are among the most common events and align with the study’s objectives.
Data-Collection Stage
A unique aspect of this study is the amount and quality of data it utilized. TuSimple ensured that the scenario variance of the dataset was as high as operationally possible by collecting data from day and night, weekdays and weekends as well as different seasons. TuSimple spent six months collecting vast amounts of highway operations data. The test data covers a universe of more than 30,000 driven miles, including various road grades and multiple trailer load conditions.
The manual driving data was collected from 60 highly experienced TuSimple professional drivers, each with significant experience in Class 8 truck driving within fleet operations. Given the years of experience and training as commercial drivers, this data serves as a representative baseline for comparison.
Data Analysis Approaches
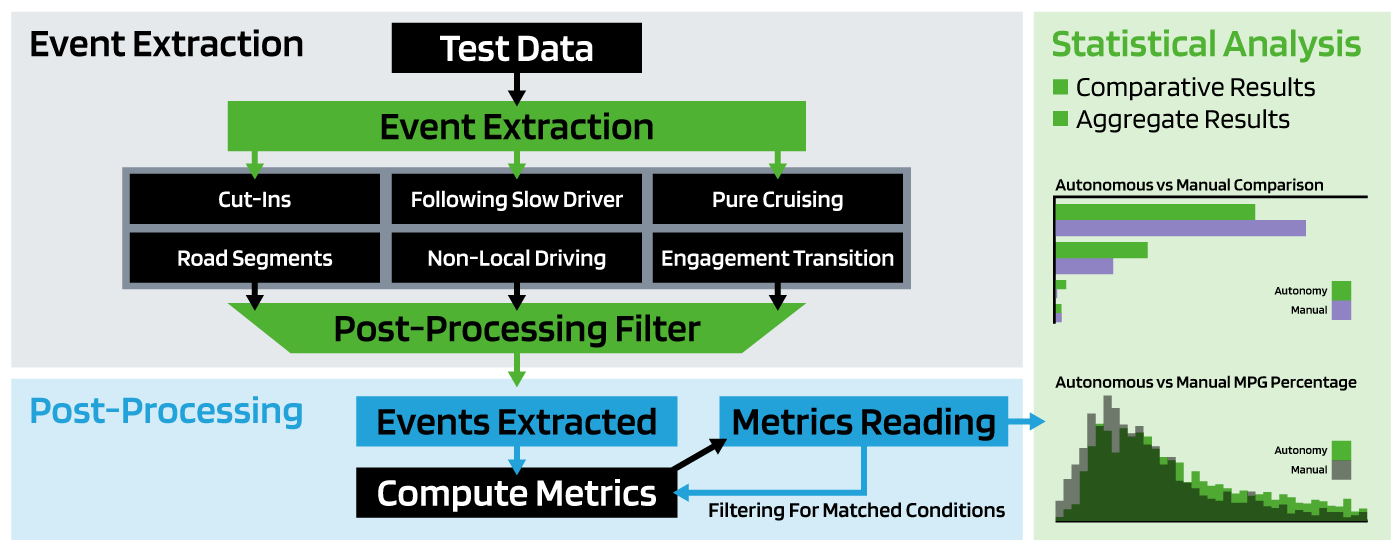
In addition to evaluating overall improvement, this study goes beyond past studies to investigate fuel economy benefits by analyzing large collections of events of interest as introduced in the previous section. The data-based analysis conducted for this study is visually summarized below. Event extraction is used to glean events from a vast TuSimple dataset. The fuel economy and performance metrics are then extracted from each event. Finally, statistical analysis is conducted to ensure that numerical results representing performance of each event type are of high confidence.
Internal tools were developed to simultaneously allow the flexible extraction of a variety of explicitly defined events from the high-density database. This allowed TuSimple to conduct high confidence analysis backed with a substantial amount of data even for narrowly defined events that rarely occur.
The data corresponding to the four event types defined earlier in this section was extracted, resulting in four data buckets, one for each event. Fuel economy and performance metrics were computed for each event and then aggregated through statistical analysis. The numerical results are discussed in the results section below. One of the metrics we used to depict actuator usage is the mode ratio for each actuator. We define four modes of operation to cover all actuator combinations, namely propulsion mode with only propulsion, coasting mode with no fuel usage, engine brake mode, and foundation brake mode. The portion of each mode is computed based on the ratio between the mode travel distance and each event’s duration. The goal for these metrics is to statistically capture the key behavior level difference.
Apart from the macroscopic statistical analysis based on large data, a microscopic study was conducted for behavior comparison between manual and autonomous driving to further justify the fuel economy improvement observed. Because the behavior for ‘Highway Cruise’ is similar, the study focuses on the vehicle interaction events, namely ‘Front Vehicle Cut-In’ and ‘Truck Following Slow Vehicle.’ Figure 5, below, shows the company’s tool layout used for time domain analysis and behavior comparison sampled from one of the ‘Truck Following Slow Vehicle’ events.
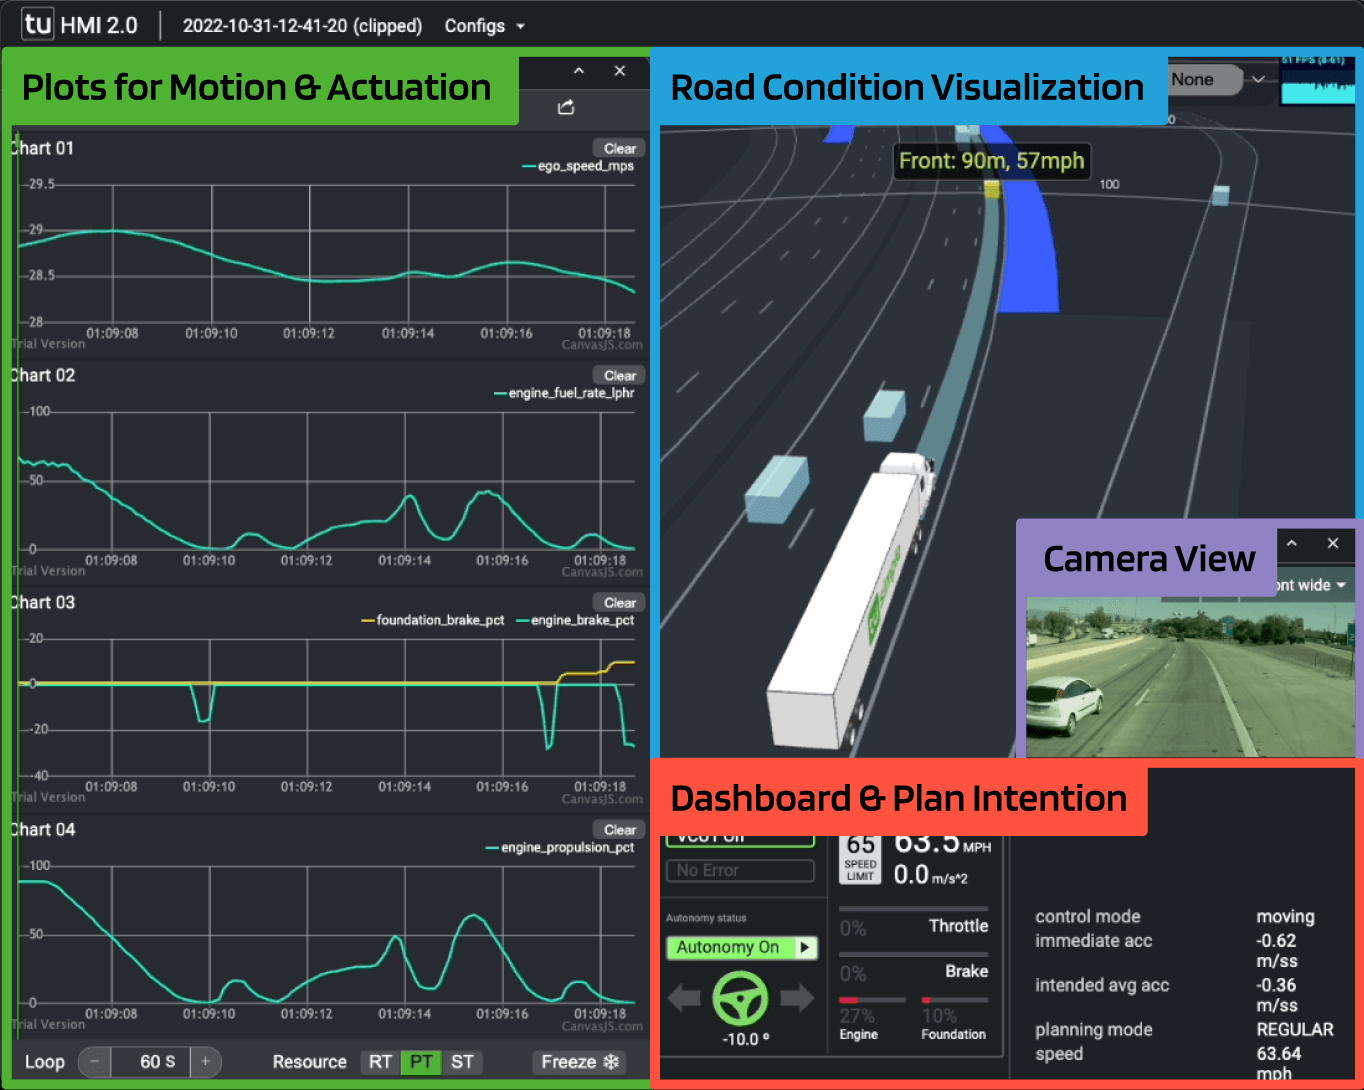
To ensure an accurate comparison, similar autonomous driving and manual driving events are selected based on entry condition similarity and time domain comparisons. Additionally, engine operation domain comparison is implemented, overlaying the engine fuel map which graphically reflects the characteristics of how the engine operates more efficiently for autonomous driving compared to that for manual driving. Leveraging TuSimple’s powerful replay capabilities of its simulation platform, any selected manual driving case can be rerun using TuSimple’s L4 autonomous technology and it can be demonstrated that under the exact same scenario, how the autonomous driver can improve behavior to save more fuel. In the following section, the results for the analysis mentioned above will be presented.
The data analysis indicates that the hypothesis for the type of major events representing fuel savings stands well as presented in the next section. The ‘Highway Cruise,’ ‘Front Vehicle Cut-In’ and ‘Truck Following Slow Vehicle’ events together represent approximately 75% of the 30,000 aggregated highway miles, which helps to explain exactly how an autonomous driving system operates in a more fuel efficient manner and justifies the final results. Therefore, the results shown in this report focuses on the three event types.
Results
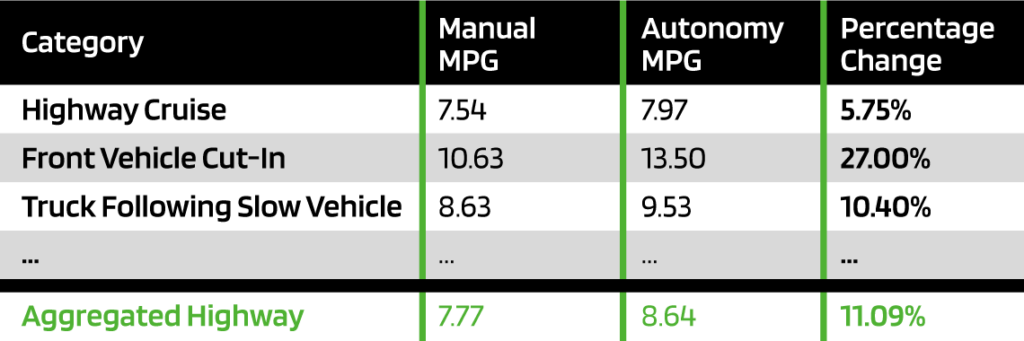
The analysis concludes an overall improvement of 11% on highways as shown at the bottom of the table in Figure 6. To arrive at the aggregated fuel savings, comparisons are conducted by looking at each event type. First, the comparison is conducted on ‘Highway Cruise’ events without any surrounding vehicle interaction. The results show a modest improvement of about 6% in fuel economy. This modest improvement is expected because there is little room left for optimization given the tight modulation in speed range. Second, the comparison is compartmentalized in two common traffic-interaction scenarios: ‘Front Vehicle Cut-In’ and ‘Truck Following Slow Vehicle.’ In both scenarios, there is a clear opportunity to save fuel because it is challenging for manually driven trucks to optimize for fuel efficiency in such events. The study found a 27% fuel economy improvement in ‘Front Vehicle Cut-In’ events and more than 10% improvement in presence of ‘Truck Following Slow Vehicle.’ The detailed results are presented in the table below.
While the results of the study show noticeable benefits for highway cruising, a deeper analysis was done for the ‘Front Vehicle Cut-In’ and ‘Truck Following Slow Vehicle’ events to emphasize the potential that L4 autonomous technology can provide beyond L2 cruise control in fuel economy. These events demonstrate a more significant gain in miles per gallon (MPG), which differentiates the results from conventional driving assistance features. The behavior differences between autonomous and manual operators when interacting with surrounding traffic are found to be the dominant factor, which are described below.
Statistical Interpretation
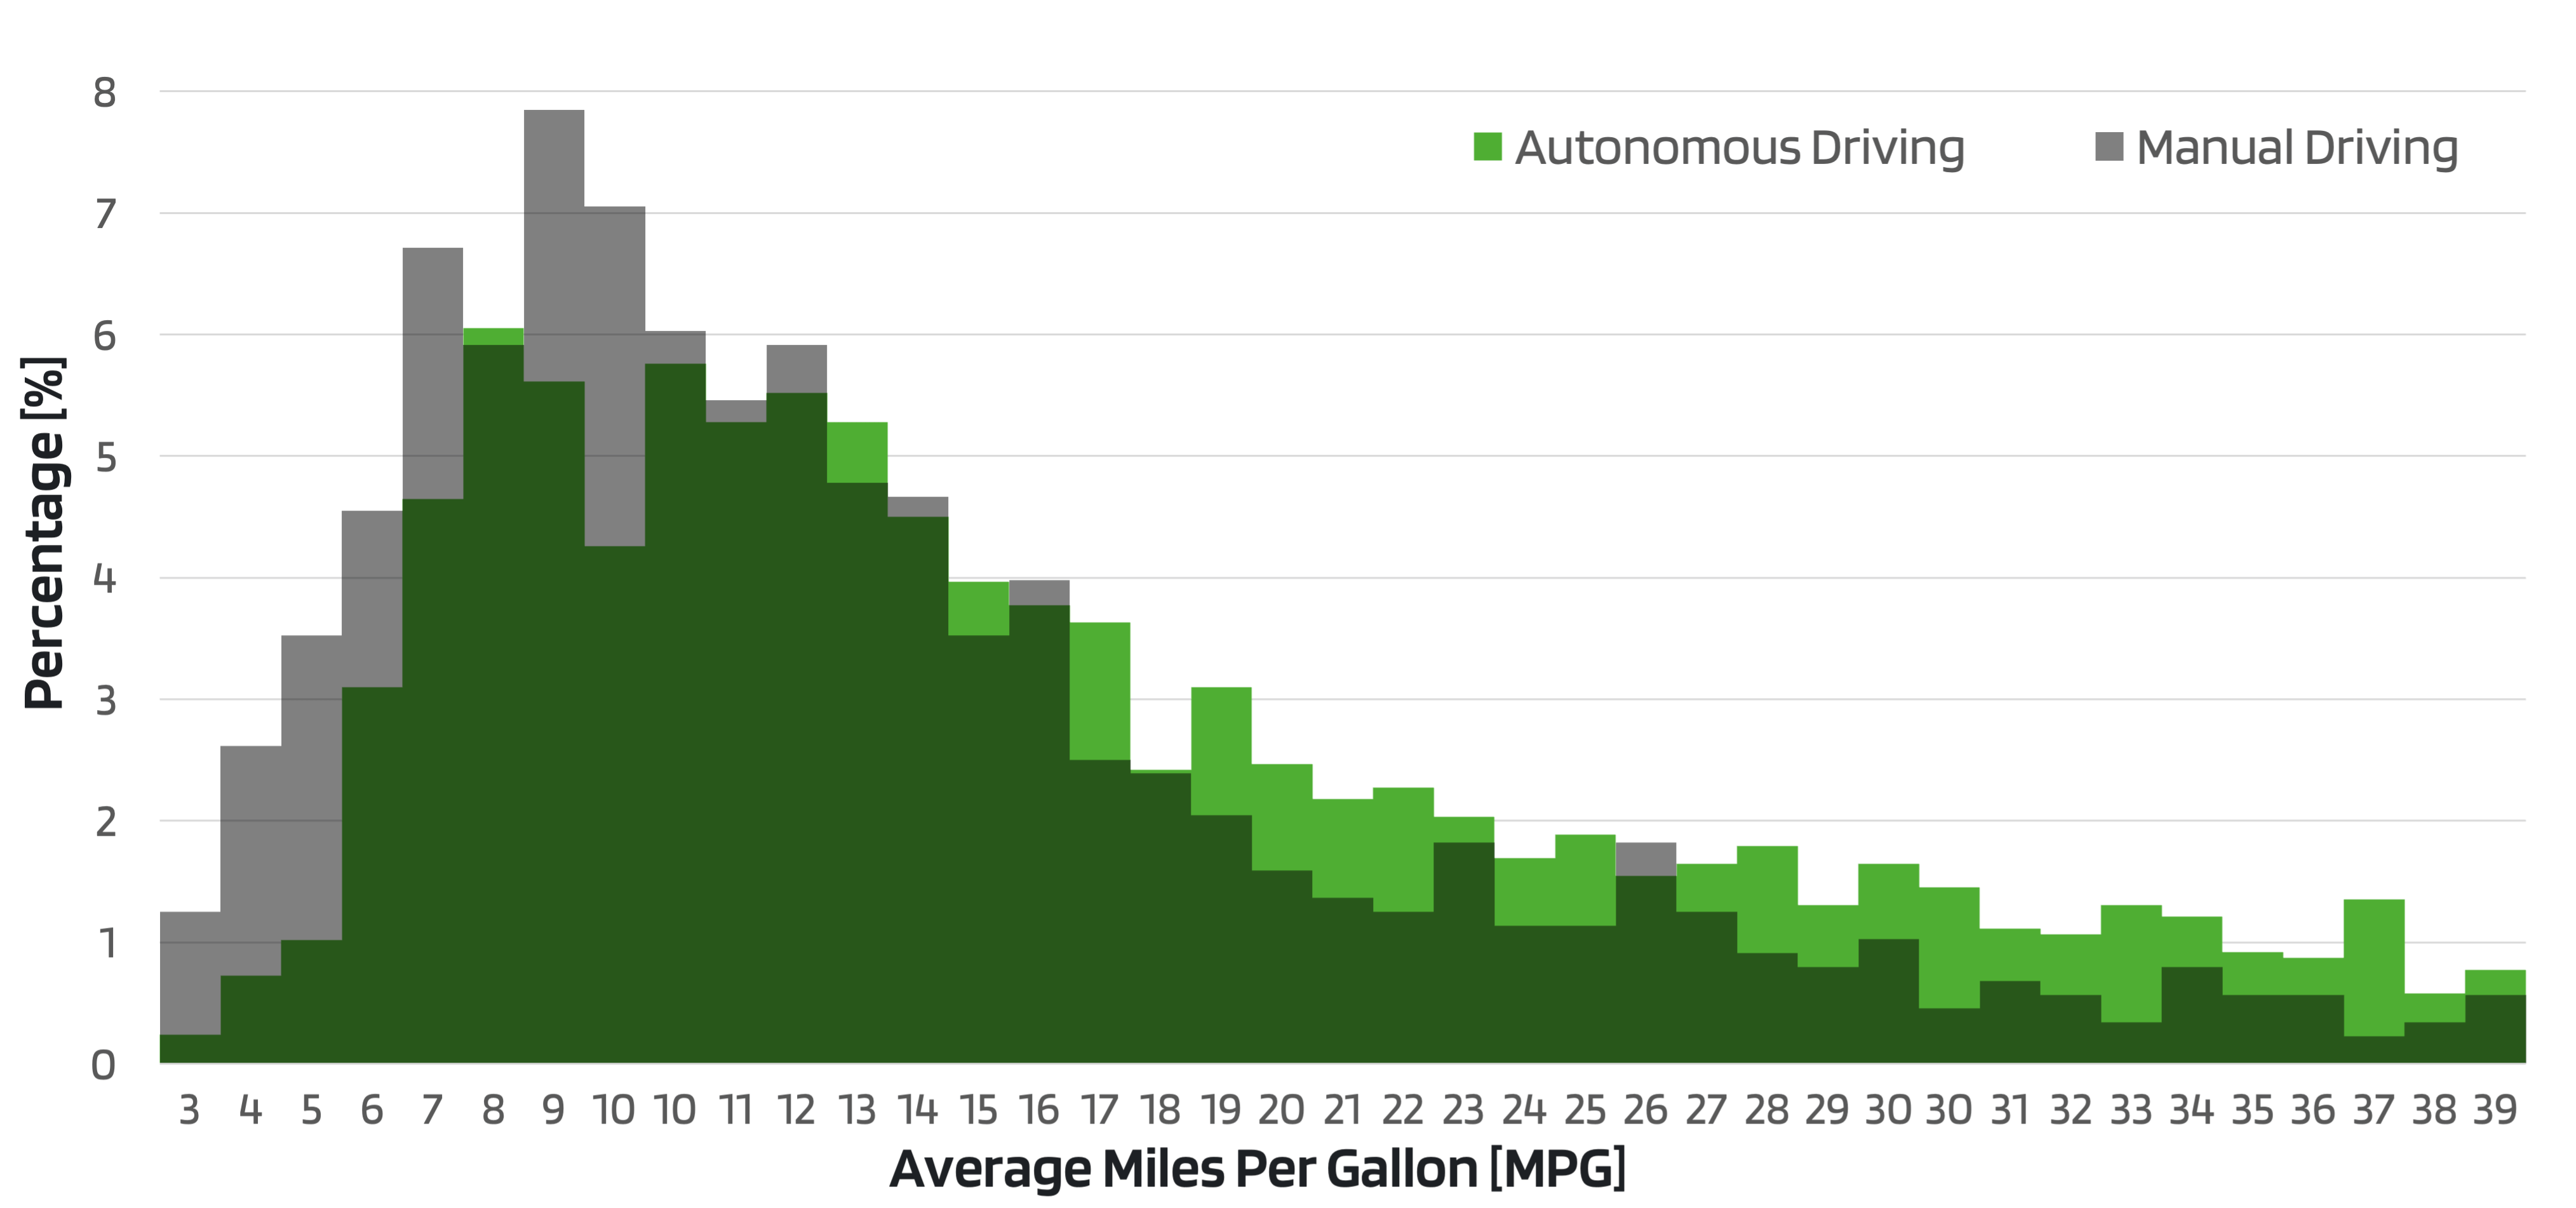
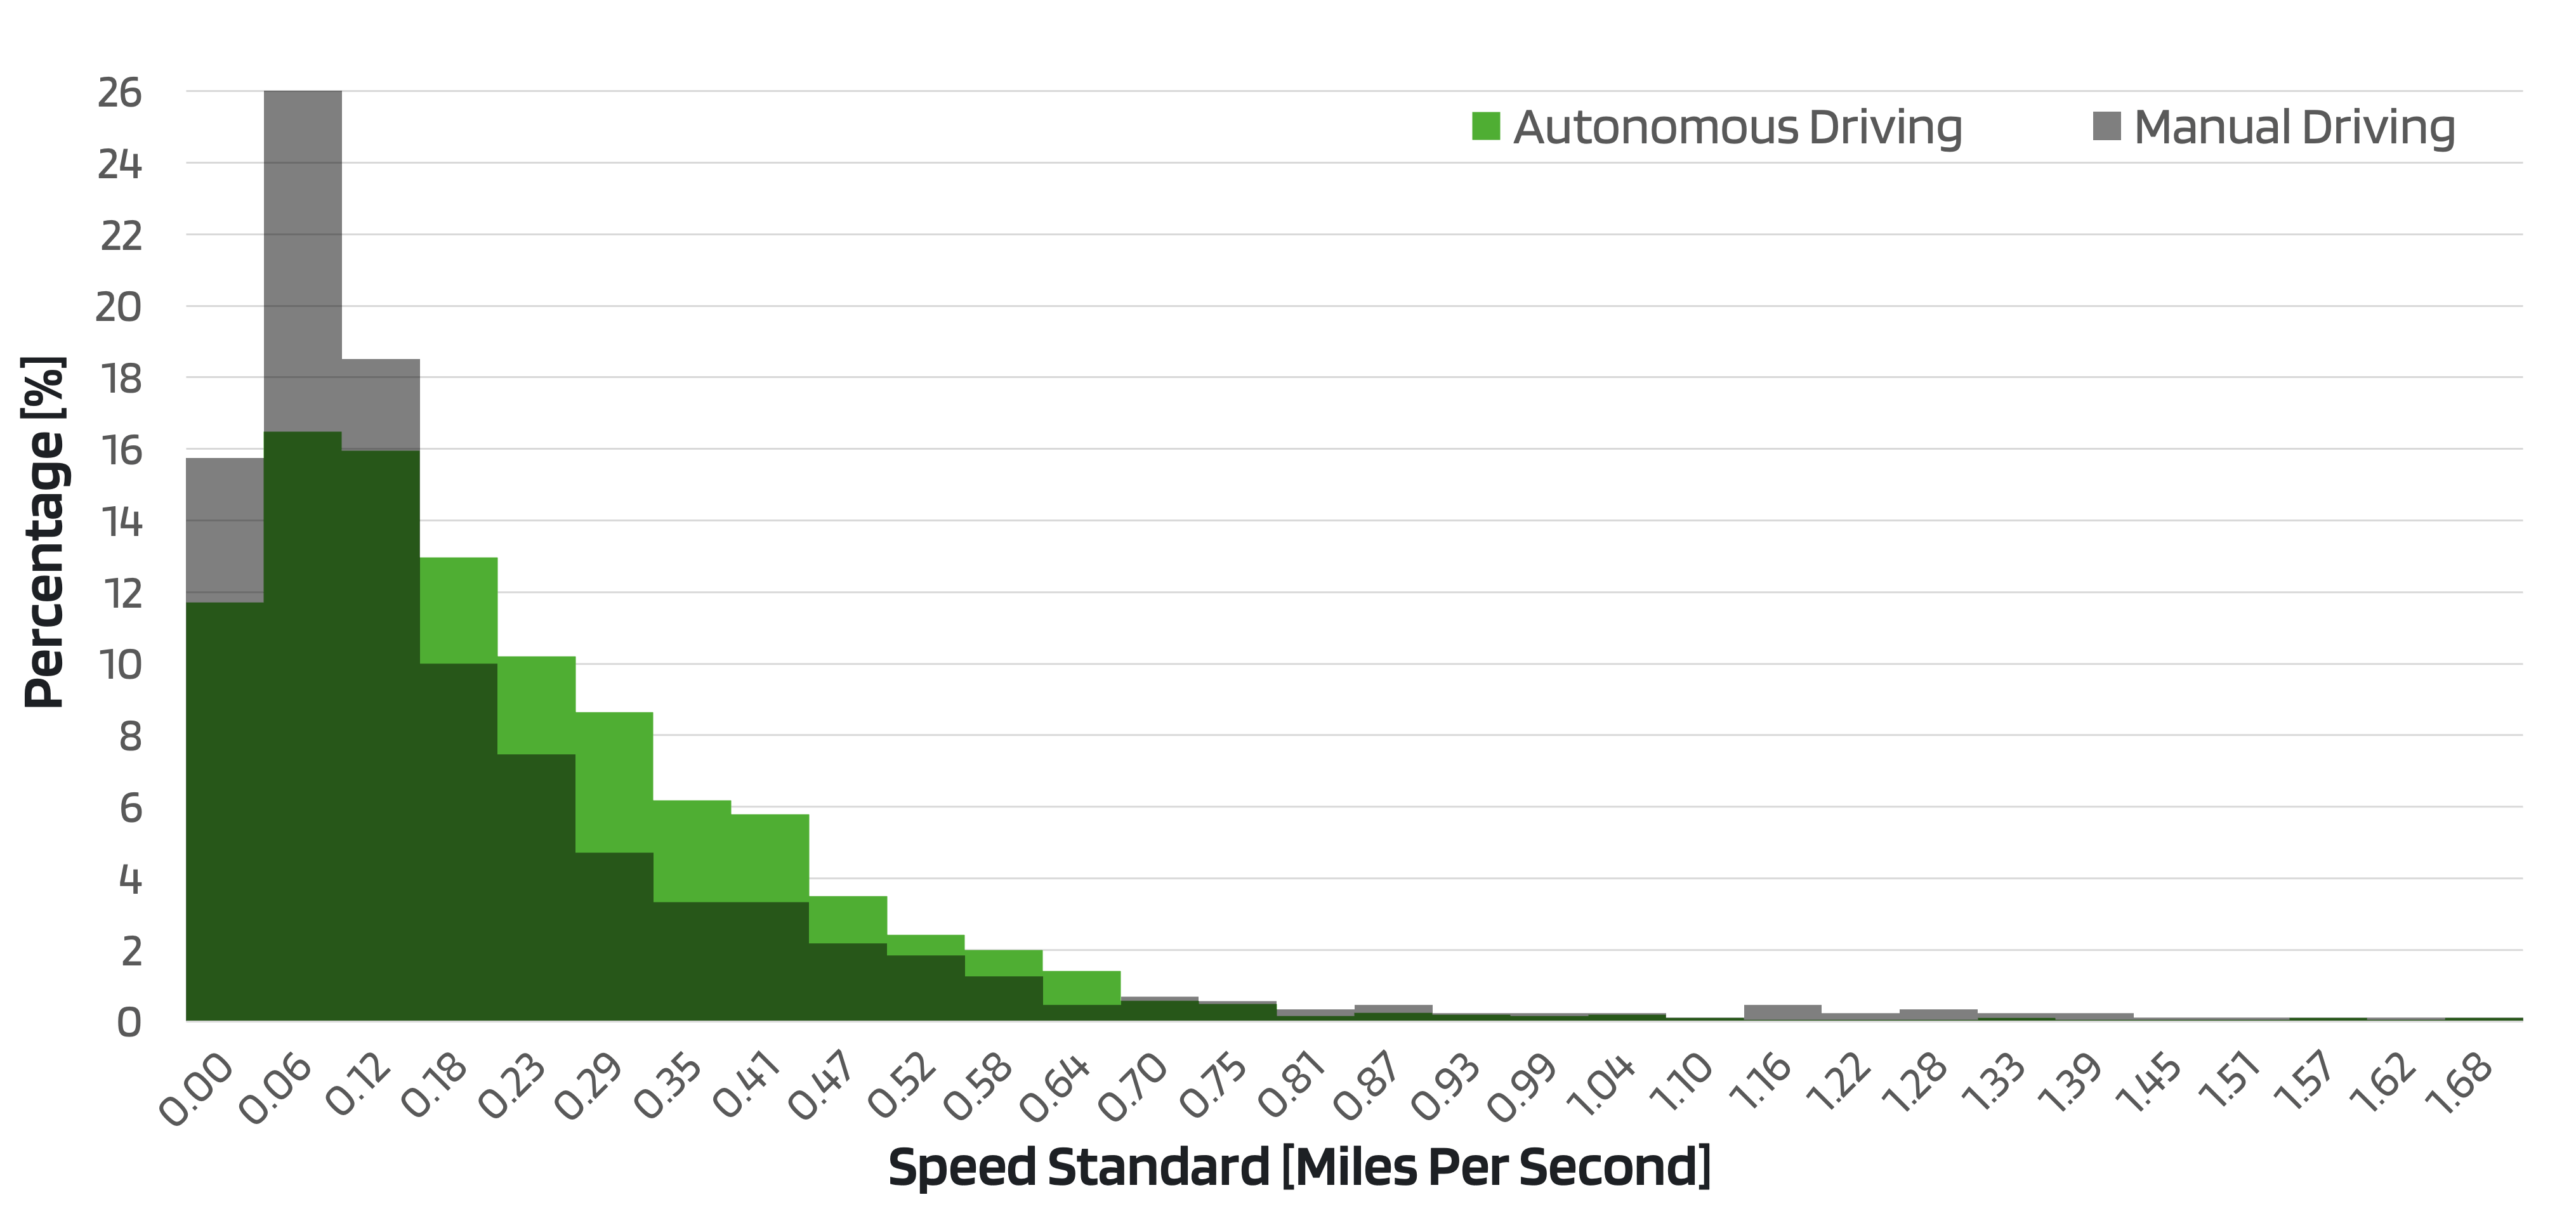
For the ‘Front Vehicle Cut-In’ event, the improvement can be seen in Figure 7 below, as more autonomy data falls towards higher MPG. The MPG for manual driving is 10.63 and autonomy is 13.5, indicating 27% improvement for autonomous driving. The distribution for speed in Figure 8 indicates that a human driver tends to take minimal reaction and maintain the original speed while more motion variation is observed for autonomous driving to allow more room when a vehicle cuts in, which reduces unnecessary fuel usage.
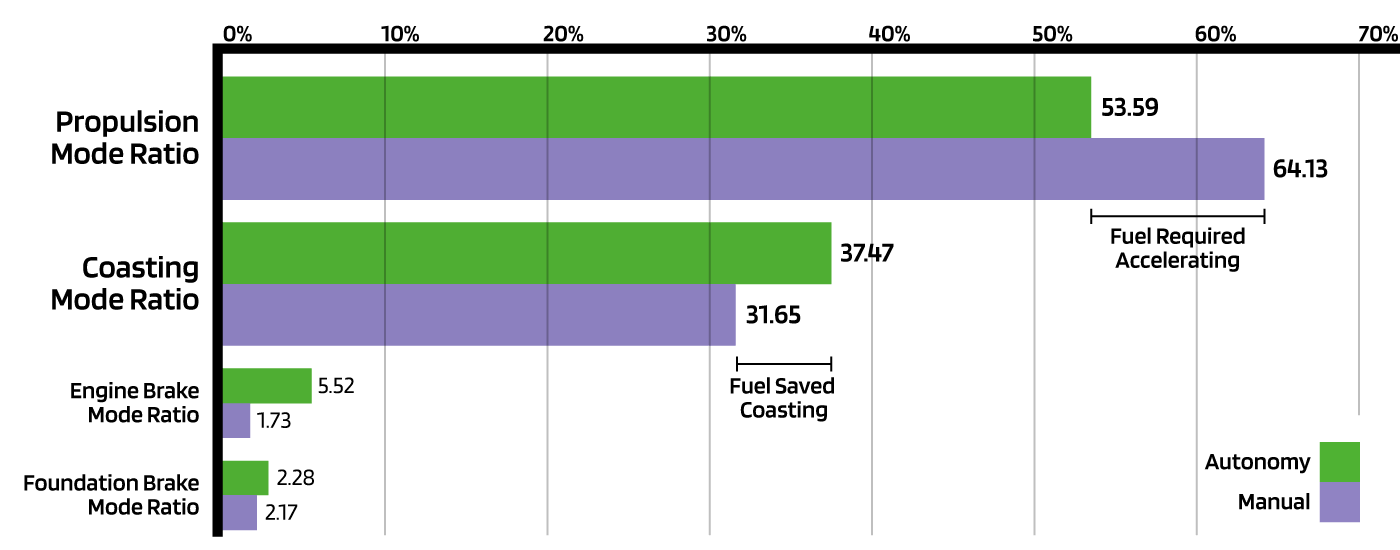
The comparison between different actuator mode percentages is summarized in Figure 9 below. It shows that autonomy reduces 11% of propulsion mode while gaining 6% more coasting duration. Meanwhile, the use of engine brakes noticeably increases for autonomy with a similar foundation brake mode ratio. The lower propulsion usage and higher percentage of coasting are clear drivers of improved fuel efficiency of TuSimple’s autonomous driving system.
Engine Operation Comparison based on Case Study
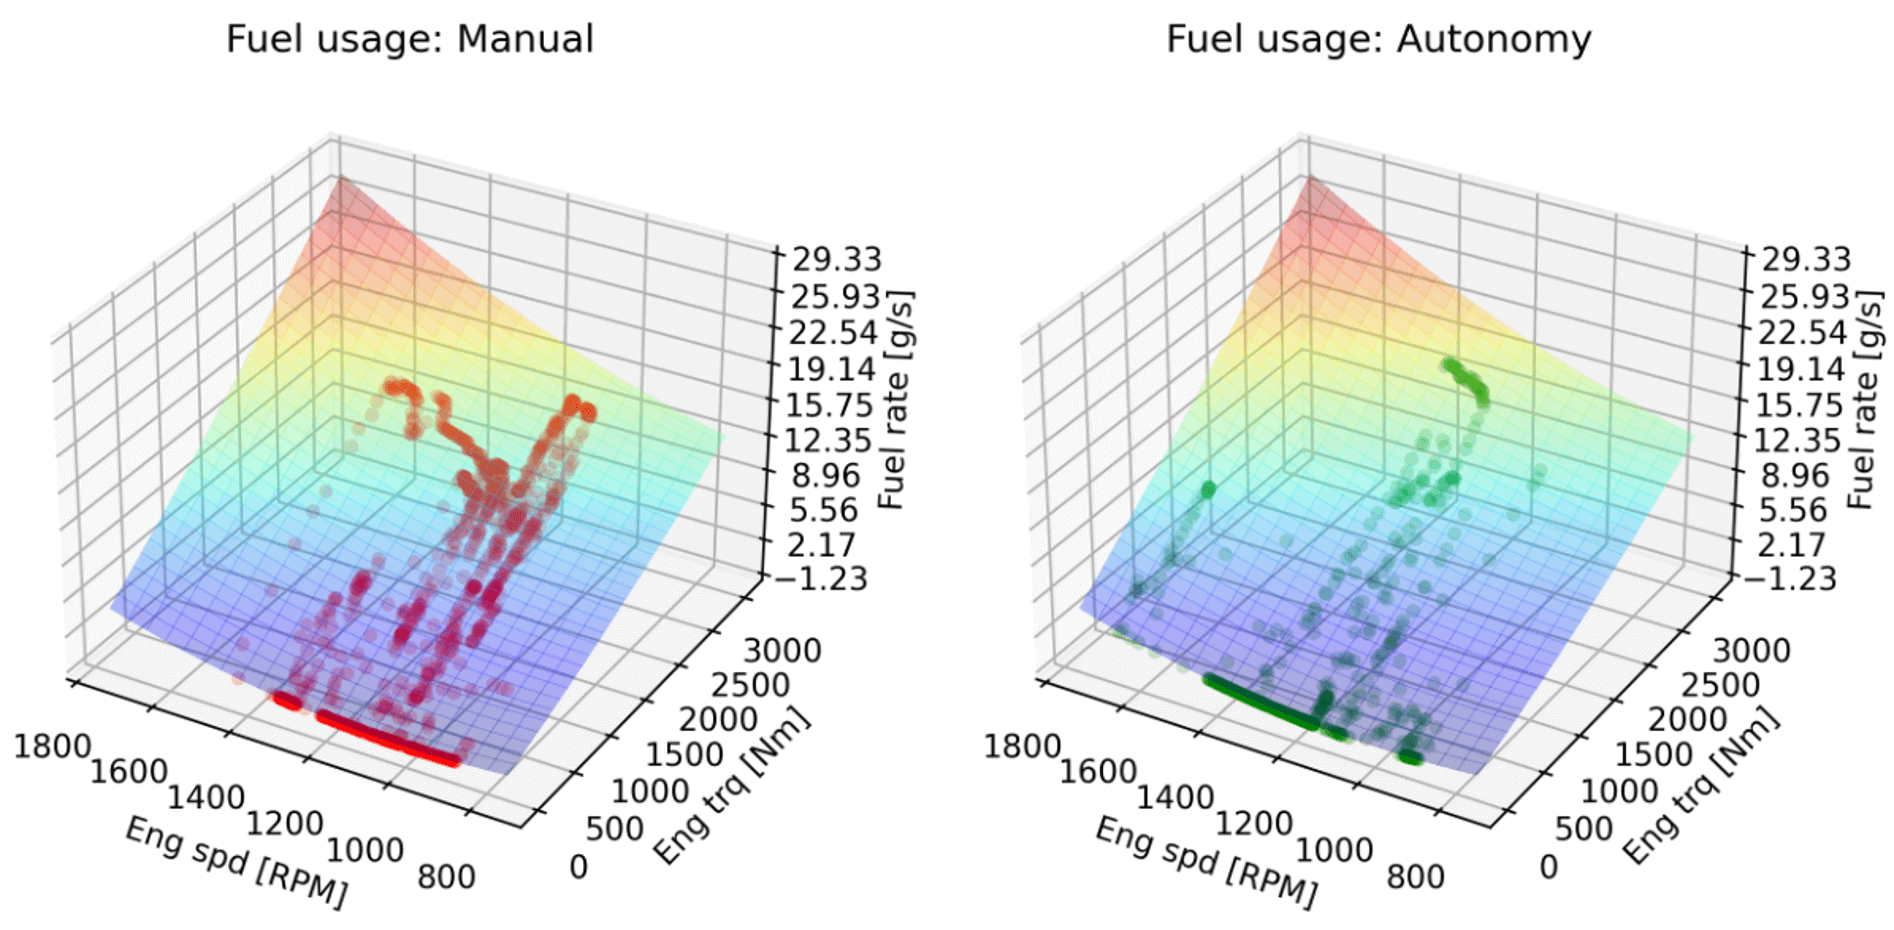
In the ‘Truck Following Slow Vehicle’ event, the behavioral difference is elaborated to explain the rationale for fuel saving based on comparison between typical manual and autonomous events with similar entry conditions. The plot in Figure 10 summarizes the improvement observed from the engine operation perspective based on actual test data for manual and autonomy in the ‘Truck Following Slow Vehicle’ event. The pattern is clear as shown in Figure 10 below. For manual driving, the torque usage is much higher, concentrating around 50% above range while autonomous driving shows more engine coasting.
Manual Driving vs Autonomy Driving Replay
As previously stated, TuSimple has the ability to replay a typical manual driving case to demonstrate how the L4 autonomous system can improve fuel efficiency. In this example, a light traffic condition is selected to illustrate the fuel economy benefit brought by autonomous driving. The entry condition is with a front vehicle traveling 11 mph slower than TuSimple’s vehicle, and a 50-meter distance gap. This is a typical scenario when a cruise operation encounters light traffic ahead. The goal is to demonstrate how autonomy handling improves fuel economy given the same traffic situation by replaying the same manual case with an autonomous driver.
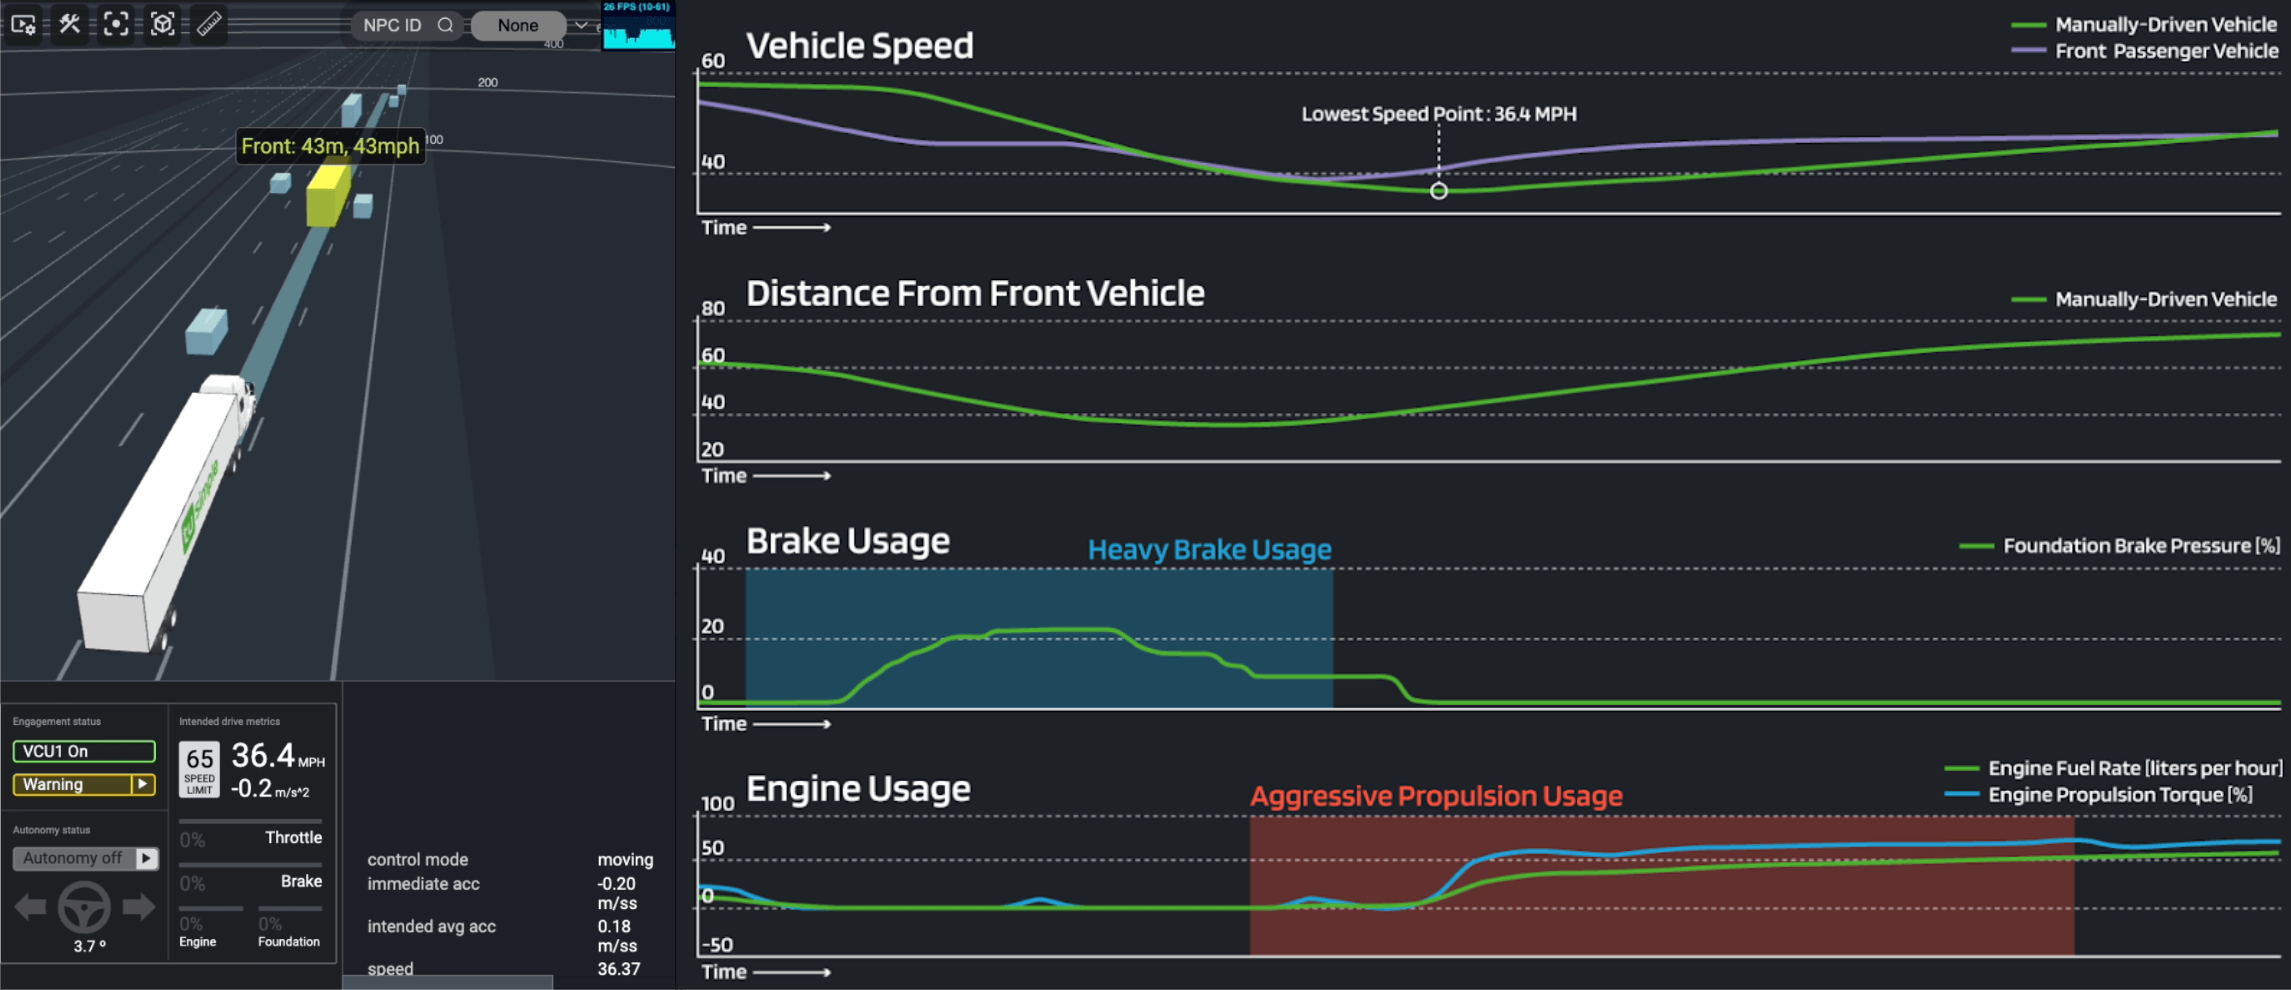
For manual driving, there is a noticeable overshoot in deceleration when handling the slow vehicle in front as shown in Figure 11 below. Distance to the front vehicle is added to the signal plot to show distance variation comparison in this specific scenario. When high-brake usage is implemented, the nature of lag dynamics of foundation brake systems makes it difficult to decelerate to the appropriate target speed without exceeding overshoot. As a consequence of the over deceleration, the truck driver has to accelerate aggressively, with nearly full throttle, as highlighted in the red box. Furthermore, after reaching a lower speed range from deceleration, unnecessary gear downshifts occur, introducing more lag during the speed-recovery stage. These large overshoot and extra compensation efforts result in worse fuel economy.
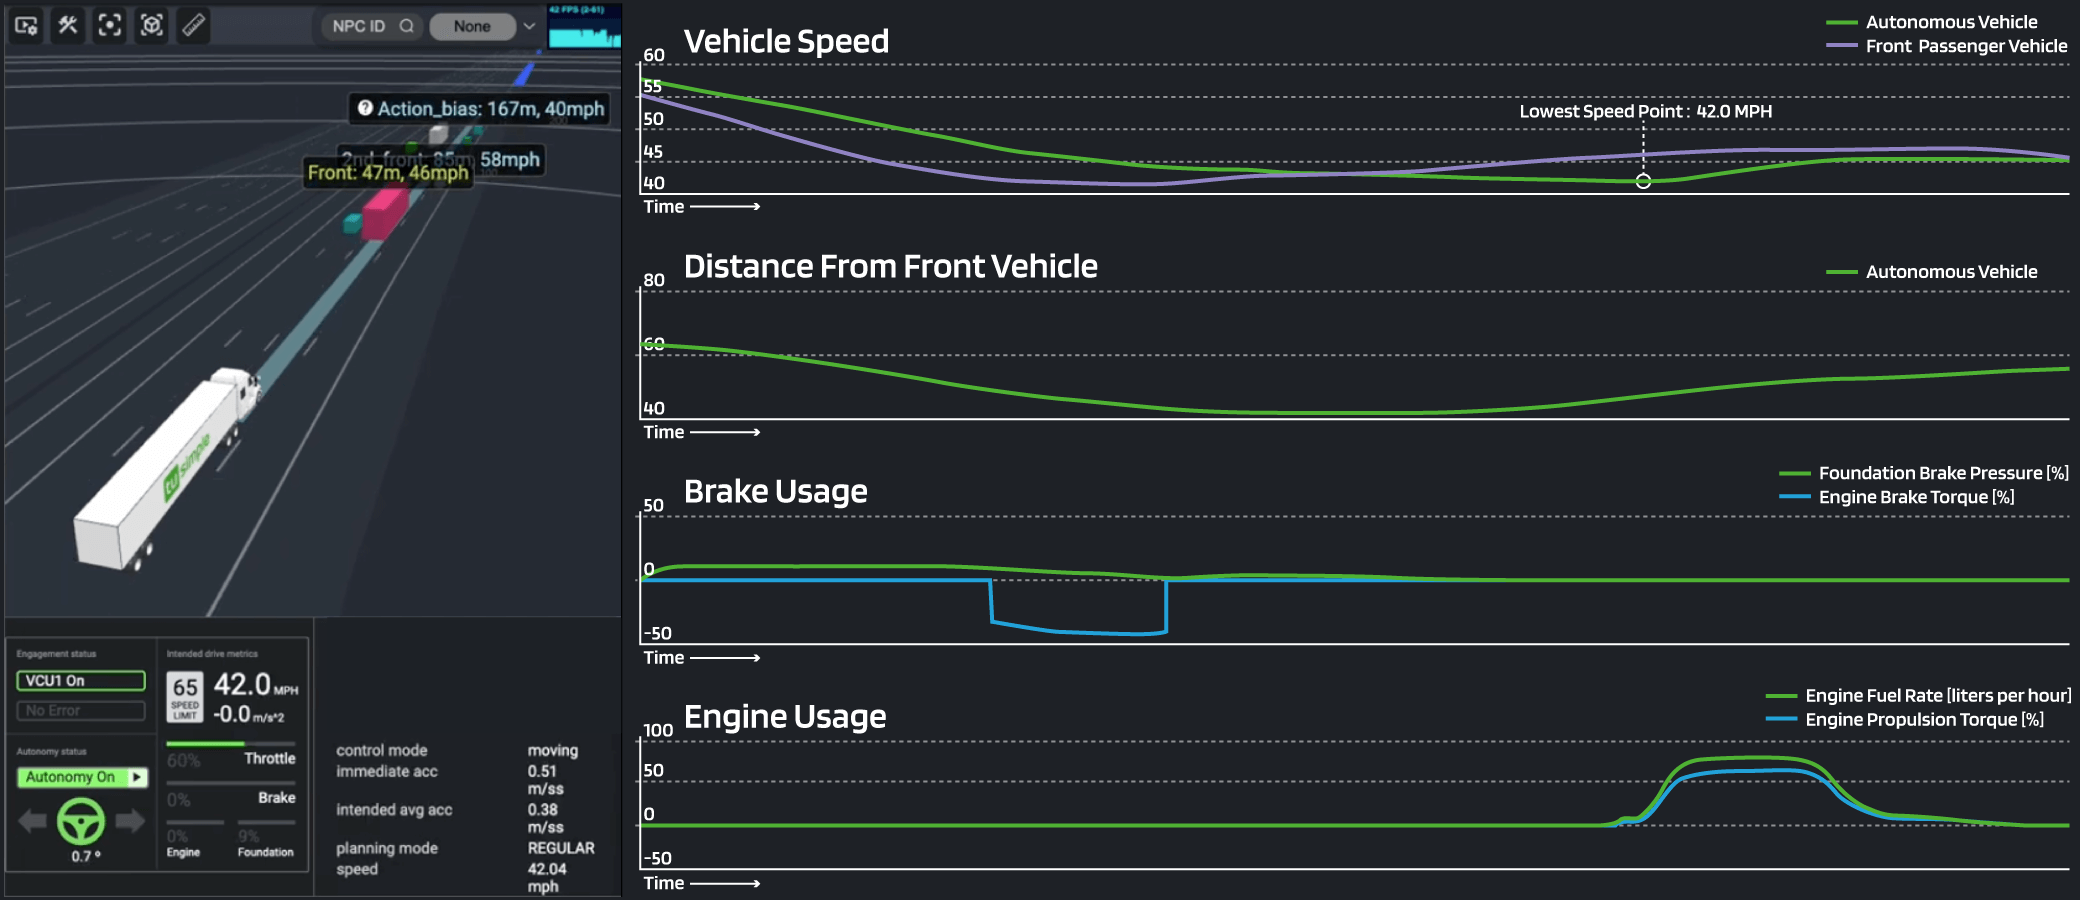
Replaying the same scene with the simulated TuSimple’s autonomous driver, the vehicle manages to precisely reduce the speed to match the front vehicle speed with much lower magnitude of foundation brake. Besides the control-precision enhancement, the motion jerk is also noticeably reduced. As presented in Figure 12 and compared with manual driving, it’s clear that the car-following behavior is less volatile. Furthermore, the optimal control avoids unnecessary gear downshift based on the powertrain model embedded to reduce lag in speed recovery.
Fuel Economy and Environmental Impact
The transportation sector, especially trucking, is integral to the global economy. It also has notable environmental implications, largely due to fuel consumption and resulting GHG emissions. Given that fuel constitutes ~30% of trucking expenses, enhancing fuel efficiency is crucial for both environmental and economic reasons.
TuSimple’s Autonomous Driving and Fuel Efficiency
TuSimple’s L4 autonomous driving technology not only reflects our dedication to innovation and a stronger supply chain, but also to sustainability and safety. TuSimple’s study indicates an 11% improvement in fuel economy during standard-highway operations. Key drivers of this improvement are dynamic and interactive events such as merging and cut-ins. TuSimple’s autonomous driving system is able to respond to these types of situations in a smoother and more graduated manner than a manually driven truck. These results highlight potential cost reductions and significant environmental advantages with fewer carbon emissions, as well as potentially reducing collisions from cut-ins.
Besides fuel-savings benefits, it’s important to call out the potential safety benefits of L4 autonomy. Smoother and more preemptive driving patterns can help increase safety. The handling using L4 autonomy, as shown in simulation replay, takes care of approaching the slow front vehicle in a much smoother way, reducing risk of rear-vehicle impact due to harsh brakes. In the ‘Front Vehicle Cut-In’ event, the algorithm takes consideration of the traffic flow and also the probability of front-vehicle deceleration after cut-in and leads to a more conservative way of driving to allow enough distance between the cut-in vehicle and the autonomous vehicle. From a macroscopic perspective, the large-scale deployment of such autonomous drivers will further benefit traffic in general, decreasing traffic congestion and potential hazards on the road.
Implications for the U.S. Trucking Industry
In a scenario where the 11% fuel efficiency improvements of TuSimple’s Arizona-based study were extrapolated to 20% of the United States trucking fleet, the potential annual fuel savings would amount to approximately 279 million gallons. This equates to a reduction in carbon emissions of about 2.8 billion kilograms or nearly 6.3 billion pounds.
The data underscores the transformative potential of autonomous driving technology. Beyond economic gains, it offers a path to reduce environmental impact to the world. TuSimple’s progress in fuel efficiency, as detailed in our study, suggests a future where economic development aligns with environmental responsibility.
Comparative Environmental Benefits
To put TuSimple’s autonomous driving technology’s environmental benefits into perspective, we’ve taken the findings from our Arizona study and explored a hypothetical scenario. If these findings were representative of the entire United States and were applied to just 20% of the long-haul trucking fleet, here’s what the potential impact could look like:
- Trees Planted: A mature tree absorbs approximately 22 kg of CO2 annually. The yearly carbon emissions savings with TuSimple’s technology equate to the absorption capacity of around 129 million mature trees.
- Cars Off the Road: A typical passenger vehicle releases about 4.6 metric tons of carbon dioxide each year. The annual savings in carbon emissions would be akin to removing about 618,000 cars from the roads.
- Household Energy Consumption: An average U.S. household consumes around 10,972 kWh annually, resulting in 4,521 kg of CO2 emissions. The yearly carbon emissions savings would match the energy consumption of approximately 629,000 homes.
- To Mars and Back: The average distance from Earth to Mars is 140 million miles. If one in five trucks in the United States had TuSimple’s autonomous driver’s fuel efficiency improvements, it would save 279 million gallons of fuel. If a semi truck could drive through space, it could make 7 round trips to Mars and back, covering 2.1 billion miles with the fuel saved.
Costs of Implementing New Technology
Implementing new ADAS and advanced autonomous driving technology inherently has upfront costs associated with the new hardware components and requisite services providing support for the technology. Some examples of the required components are radars, LiDARs, cameras, ultrasonic sensors and domain controllers for centralized compute processing.
Radar and LiDAR systems are being implemented by automotive trucking OEMs today as they progressively look to push L2 ADAS features and eventually into L4 autonomous technology. As production and supply chains ramp up to meet the growing demand for more advanced automated features, volumes will push these technologies into thresholds where the long term return on investment not only breaks even, but also adds value back into operations that are unprecedented.
Return on Investment
A fleet of 1,000 vehicles today that runs 120,000 miles (per truck1) on highways can expect an immediate fuel efficiency savings on its investment.
Assuming a similar ODD as the study and 11% efficiency gains, with diesel at $4.45 per gallon, the company would save nearly $7.5 million in fuel costs annually. Over an industry average truck useful life of 5-8 years for large fleets2, this would equate to $37-$60 million in fuel savings alone.
The fuel savings above does not factor in the additional savings potential from advanced safety features from ADAS technology, such as accident mitigation and prevention, nor the benefits of combining the technology with other fuel efficiency products that reduce drag aerodynamic coefficients.
References
[2] https://www.trucking.org/economics-and-industry-data
[3] https://www.freightwaves.com/news/what-is-operating-ratio
[4] https://www.epa.gov/system/files/documents/2023-06/420f23016.pdf
[5] https://sonar.freightwaves.com/freight-market-blog/operating-a-truck-infographic
[6] https://convoy.com/blog/class-8-truck-order-replacement-rate/
Try the Calculator for yourself
11% Fuel Eciency Improvement with TuSimple’s Autonomous Driver